My most intimate self portrait
The NSA claimed that it was only collecting metadata—a fact we now know is false—but even metadata can tell an intimate story.
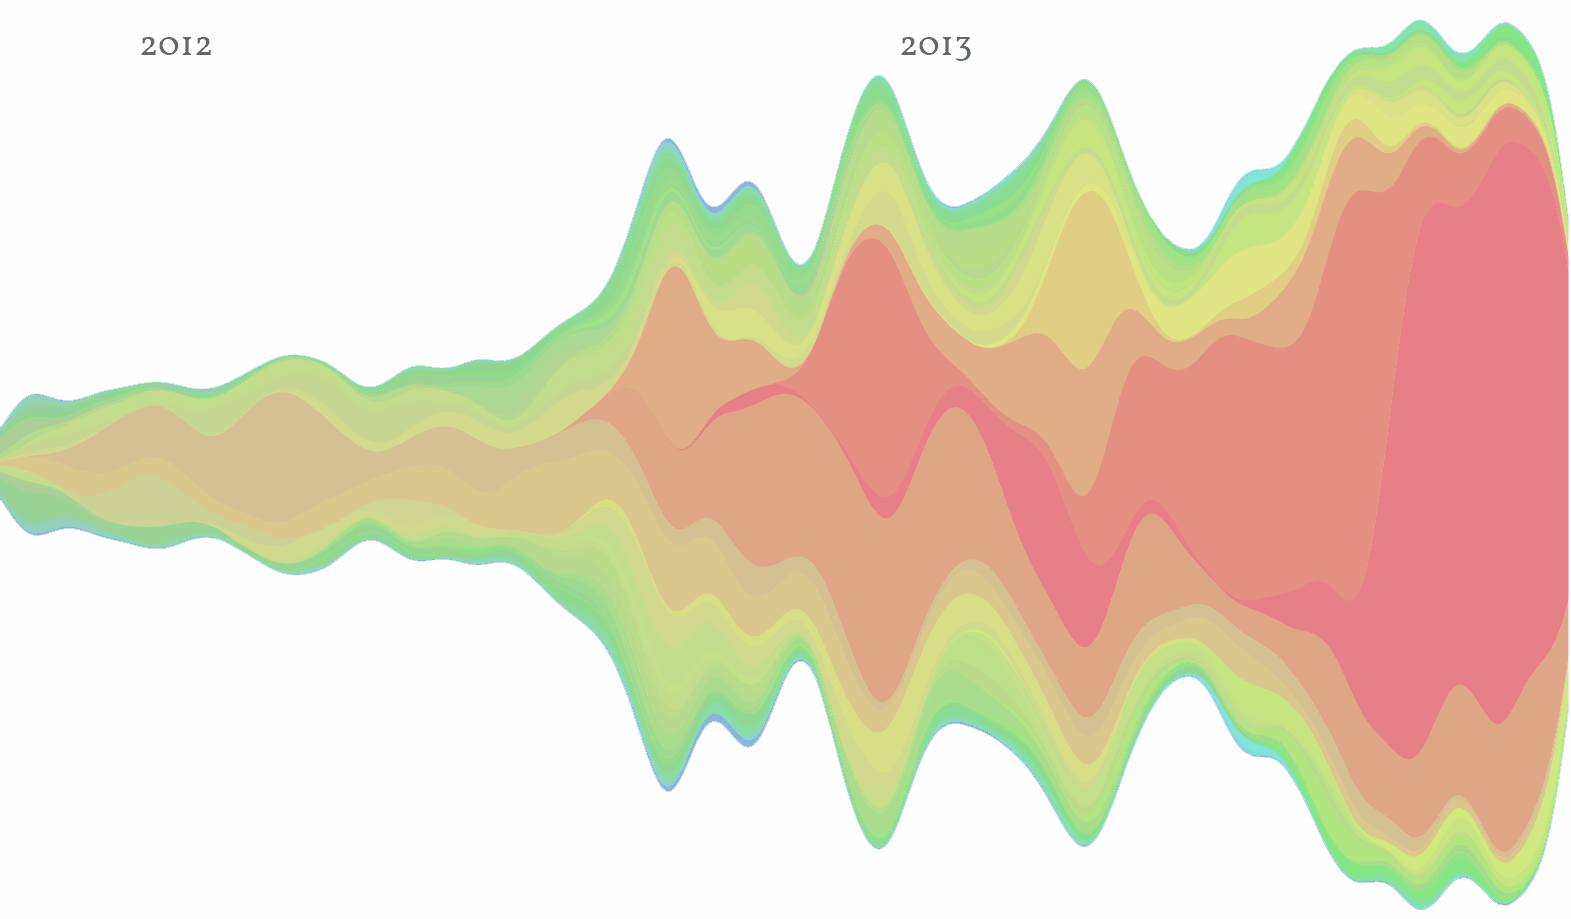
The visualization above was generated by the PRISM app, named after the infamous NSA spying program. The premise is that you give it an iTunes backup of your SMS history (a terrifying proposition itself, but a risk I was curious enough to take) and it analyzes the volume of messages sent to each contact.
I generated this graph of 29,224 messages over a year ago but I still look at it almost every day. It’s hanging in my bedroom at home and in my office at work. In many ways, it’s my favorite self portrait.
The reason this is my favorite self portrait is that it happened to catch a transitionary moment in my life. In the end of 2012 I had moved back to Colorado from Florida after I quit my job at Grooveshark. I’d been away from home long enough that I’d drifted away from most of my old friends and didn’t really have anyone to talk to. I was lonely, maybe even depressed.
####And that’s how it was for most of 2012.
Around the beginning of September 2012, however, I met some people at my college radio station that I would go on to co-host a radio show with and ultimately become very close to. The darkest red line in the graph is now my girlfriend.
Other threads come in and leave. The big bumps correspond to important occasions in my life or others’, or to breaks when I wasn’t seeing people face to face as much. I can see relationships come and go and remember things that happened during those times.
If I look closely, I can see a new job, vacations and a death in the data. I can even see where I moved past it all and stopped feeling the need to communicate so much. It may just be text messages, but it all correlates to things that are really real.
And all of it is captured in this graph.